-
Hotline0086-755-27198826-601
- emai:y@3nh.com
- add:F/6, Block 5B, Skyworth Inno Valley, Tangtou 1st Road, Shiyan, Baoan District, Shenzhen, P.R. China.

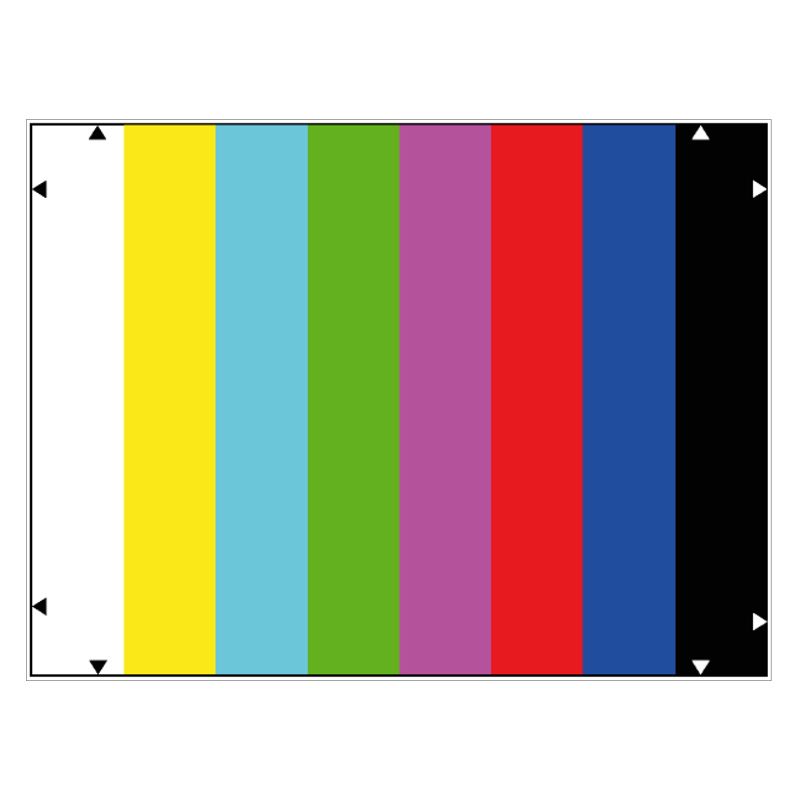
COLOR BAR TEST CHART 16:9 Y0E106
- Product Introduction The test chart YE0106 is designed for checking the color rendition of TV cameras. The picture area is divided into 6 color bars showing the three primary colors red, green and blue and the secondary colors cyan, yellow

-
Product details
-
Parameters

Product Introduction
The test chart YE0106 is designed for checking the color rendition of TV cameras.
The picture area is divided into 6 color bars showing the three primary colors red, green and blue and the secondary colors cyan, yellow and purple; in addition there is one bar of white and black. The succession is from left to right - white, yellow, cyan, green, purple, red and blue - corresponds to that of an electronically generated color bar.
The colors of the test chart are close to those of the electronic 100/75 color bar. When using standard light D65 the color of the test chart have the following color coordinates in the CIE-xy-diagram as are shown in the table below and compared with the standard values.
| COLOR | EBU STANDARD | TE106 WITH D65 | ||
| x | y | x | y | |
| white | 0.31 | 0.33 | 0.31 | 0.33 |
| yellow | 0.41 | 0.50 | 0.42 | 0.49 |
| cyan | 0.22 | 0.33 | 0.24 | 0.32 |
| green | 0.29 | 0.60 | 0.30 | 0.53 |
| purple | 0.32 | 0.15 | 0.33 | 0.18 |
| red | 0.64 | 0.33 | 0.59 | 0.34 |
| blue | 0.15 | 0.06 | 0.18 | 0.15 |
Due to the manufacturing process the color value of the test chart deviate slightly from the standard value. The largest deviations are with green and blue. In fact, for physical reasons reflecting color con not reach the same saturation as light color. The color of test transparency TE106 D280 e.g. come much closer to the standard colors. As to the colorimetric details it hat to be noted that different measuring devices and methods may lead to significant deviations.
The following diagram shows the standard color coordinates and those of TE106 entered in the CIE-xy-coordinate-system.
The brightness of the colors is matched with the electronic 100/75 color bar. To compare the luminance of the reflecting color with standard value, the following table shows the L*-value in the CIE-L*a*b*-diagram.
| COLOR | EBU STANDARD | TE106 WITH D65 |
| L* | L* | |
| white | 100 | 100 |
| yellow | 77.3 | 79.9 |
| cyan | 71.9 | 73.0 |
| green | 69.1 | 70.7 |
| purple | 47.5 | 37.6 |
| red | 41.9 | 45.4 |
| blue | 23.6 | 29.4 |
Different types of cameras have different spectral sensitives and therefore different matrix circuits. Therefore no general binding statement can be made for the test chart in respect of measurements by vectorscope or oscilloscope.
The calculated vectoscope image is shown below.
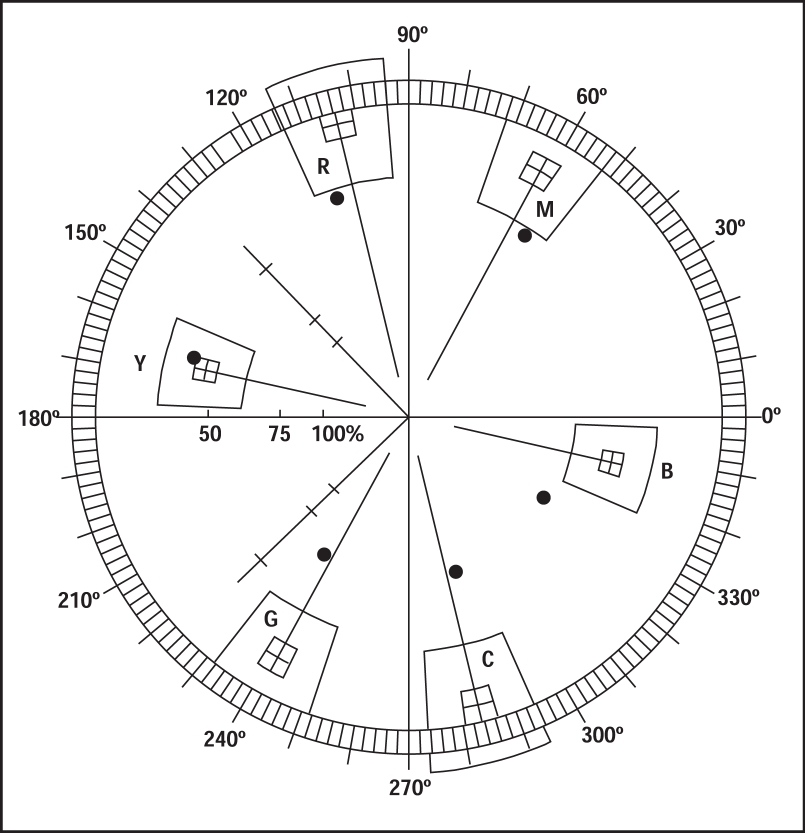
The black spots show the calculated color coordinates in the vectorscope.
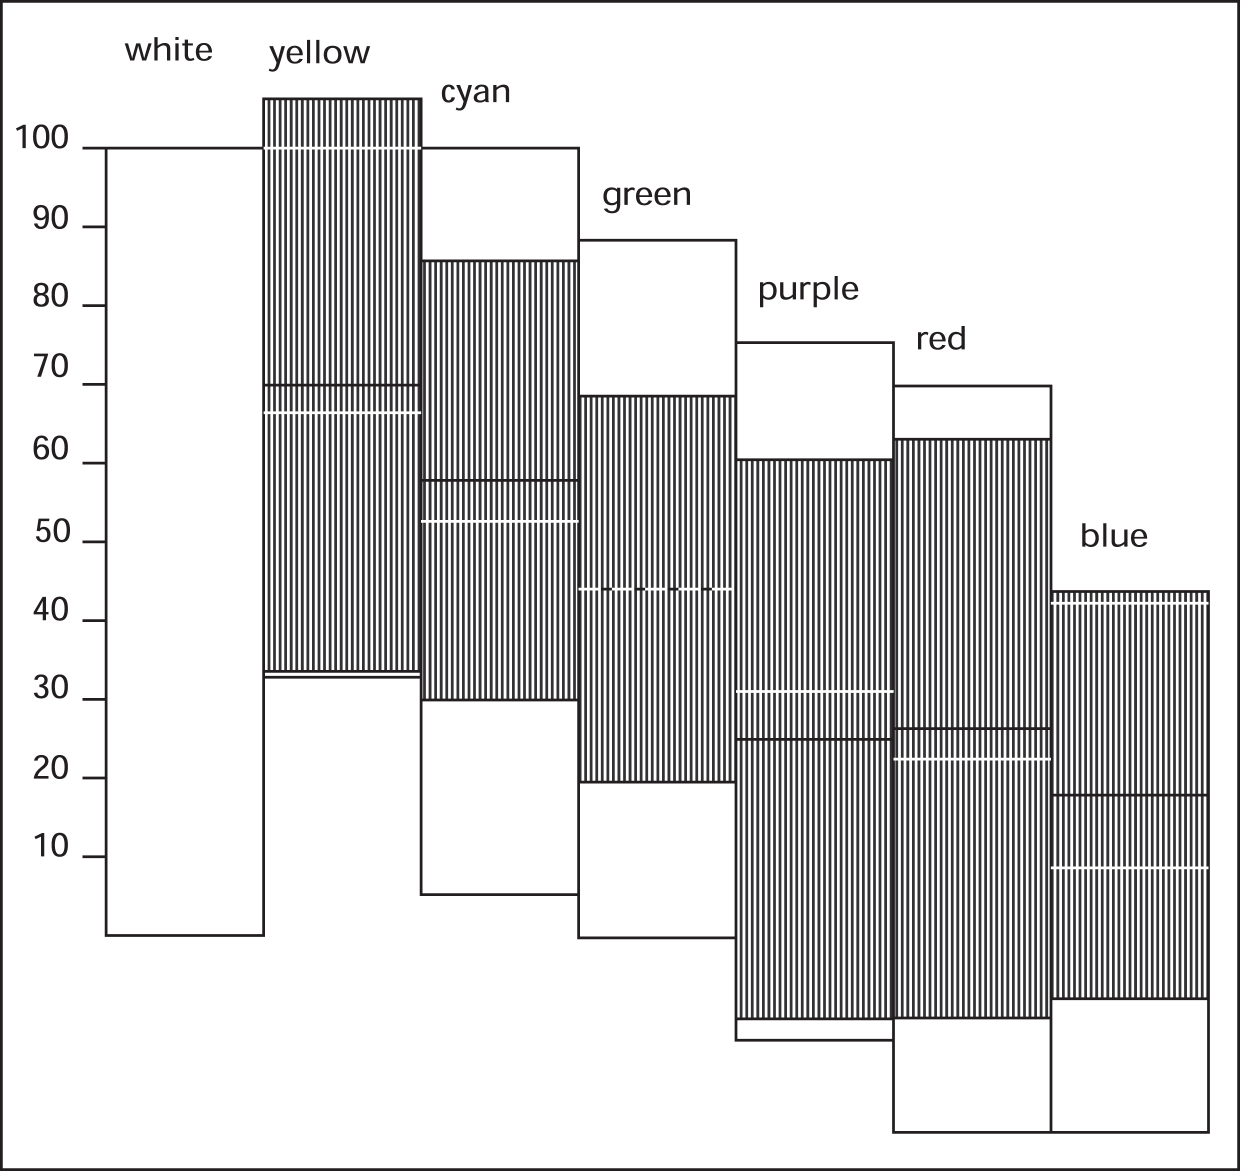
The following diagram compares the standard values of the luminance signal Y of the 100/75 color bar with the computed value of the test chart colors.
| COLOR | EBU STANDARD | TE106 WITH D65 |
| Y | Y | |
| white | 100 | 100 |
| yellow | 66.4 | 69.9 |
| cyan | 52.6 | 57.8 |
| green | 44.0 | 44.0 |
| purple | 31.0 | 24.9 |
| red | 22.4 | 26.3 |
| blue | 8.6 | 17.8 |
In the diagram below the oscilloscope image if the 100/75 standard color bar is compared with the calculated value of the test chart colors. The striped areas show the FA-signal for the test chart color values. The underlying white fields marked in black outline show the standard FA-signals. White lines within the striped areas mark standard values of the Y-signal resp. the upper limit of the standard FA-signal for yellow and blue.