


-
Hotline0086-755-27198826-601
- emai:y@3nh.com
- add:F/6, Block 5B, Skyworth Inno Valley, Tangtou 1st Road, Shiyan, Baoan District, Shenzhen, P.R. China.

MULTI BURST TEST CHART YE107
- Product Introduction A line raster is arranged in the center of the test chart which produces frequencies of 0.5 to 10 MHz in the output of the TV camera. 0.5 MHz line pairs are also arranged at the center of the line raster immediately adj

-
Product details
-
Parameters
Product Introduction
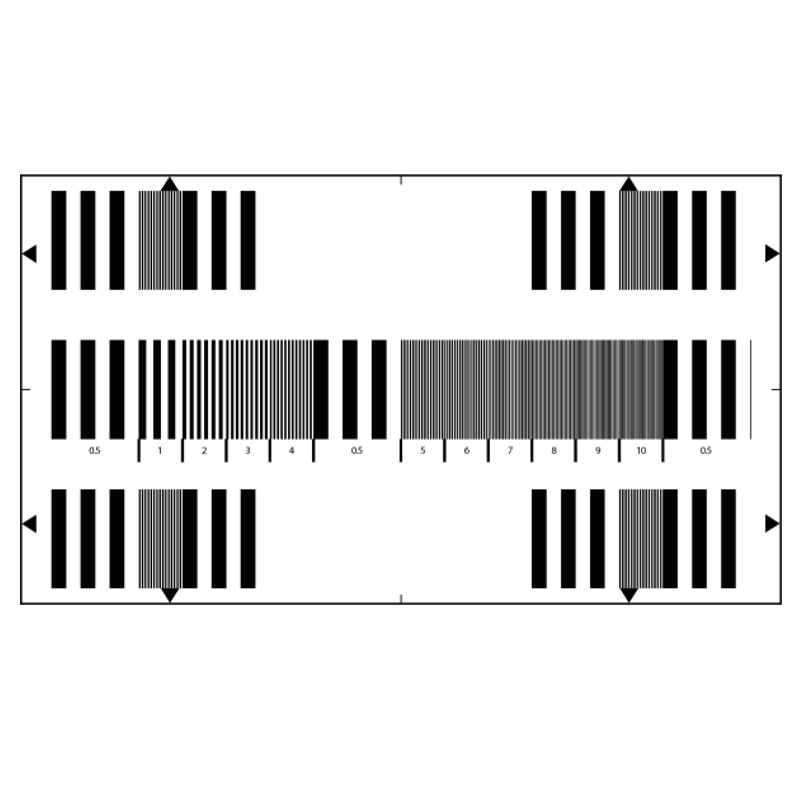
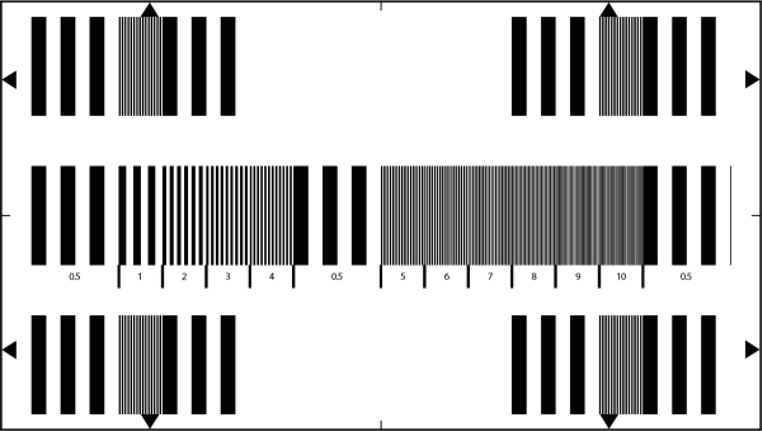
A line raster is arranged in the center of the test chart which produces frequencies of 0.5 to 10 MHz in the output of the TV camera. 0.5 MHz line pairs are also arranged at the center of the line raster immediately adjacent to the 5 MHz line pairs. Bar rasters are located in the corners of the test charts and produce frequencies of 0.5 and 5 MHz.
The frequencies response of modulation depth and the uniformity of modulation depth can be established with the aid of the line rasters. The signal amplitude of the 0.5 MHz rasters is the reference value.
Measuring equipment: Video oscilloscope or preferably video oscilloscope with memory.
Measurements conditions: The camera settings must be as follows
Shading correction: ON
Aperture correction: OFF
Gamma correction: OFF
Contour correction: OFF
Color correction: OFF
Iris: F/5.6 for 2/3 “CCD, F/4 1/2” CCD
The test chart is evenly illuminated so that for the low frequency burst at 0.5 MHz the amplitude of the video signal at the output of the correctly positioned and focused camera is 0% (0V) for the black bars and 100% (700mV/ 75 Ohms) for the white bars.
Care must be taken to avoid clipping of the signal to be measured at the black and white level.
Measurement procedures
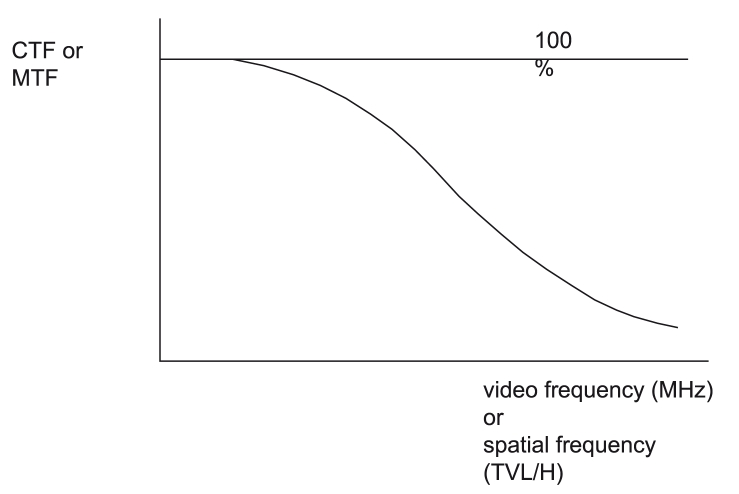
Measurements can be made on the various camera output signals, but preferably on the Y luminance signal (or coded Y with perfect B and W balance). This measurement is made at the center of the image and at the corners so that account is taken of the lateral chromatic aberration of the lens. In addition to determining camera response to the particular value of 5 MHz, measurement of the response at the other frequencies serves to plot a curve giving contrast loss according to the spatial frequency of the test chart. Frequency bursts of 0.5 MHz and 1 to 7 MHz are recommended for this measurement. The measurements give the contrast loss of the camera response at the value of 1 to 7 MHz. The obtained response is a contrast transfer function (CTF).
Mathematical relations can be used to calculate the MTF according to the CTF values:
MTF(N)= π/4[CTF(N) + 1/3 CTF(3N) - 1/5 CTF(5N) + 1/7 CTF(7N) - 1/9 CTF(9N) + 1/11 CTF(11N) ...]
where N is the spatial frequency of the test chart analysed; N in TVL/H
In the - probable - case of a beat affecting camera response for a given spatial frequency, and under certain conditions only, the measured signal reassembles an amplitude-modulated carrier signal, as shown in the following figure.
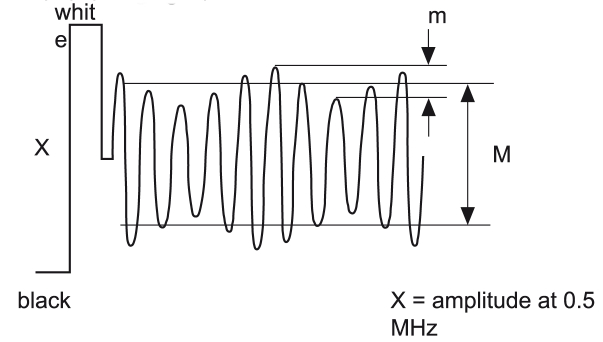
The percentage of modulation is then defined by the relation:
% mod = M / X
The interference ripple at this frequency is given by:
p % = m / M
x = Amplitude of the 0.5 MHz signal
The results of the measurement can be shown in a table representing the various areas of the image measured.
CTF values at 5 MHz
xxx % xxx %
xxx %
xxx % xxx %