


-
Hotline0086-755-27198826-601
- emai:y@3nh.com
- add:F/6, Block 5B, Skyworth Inno Valley, Tangtou 1st Road, Shiyan, Baoan District, Shenzhen, P.R. China.

HDTV RESOLUTION TEST CHART YEO124
- Product Introduction The test chart with an aspect ratio of 16:9 shows in the middle area 9 blocks containing 42 resolution patterns each. The corner fields have 20 resolution patterns. The resolution patterns are arranged in such a way tha

-
Product details
-
Parameters
Product Introduction
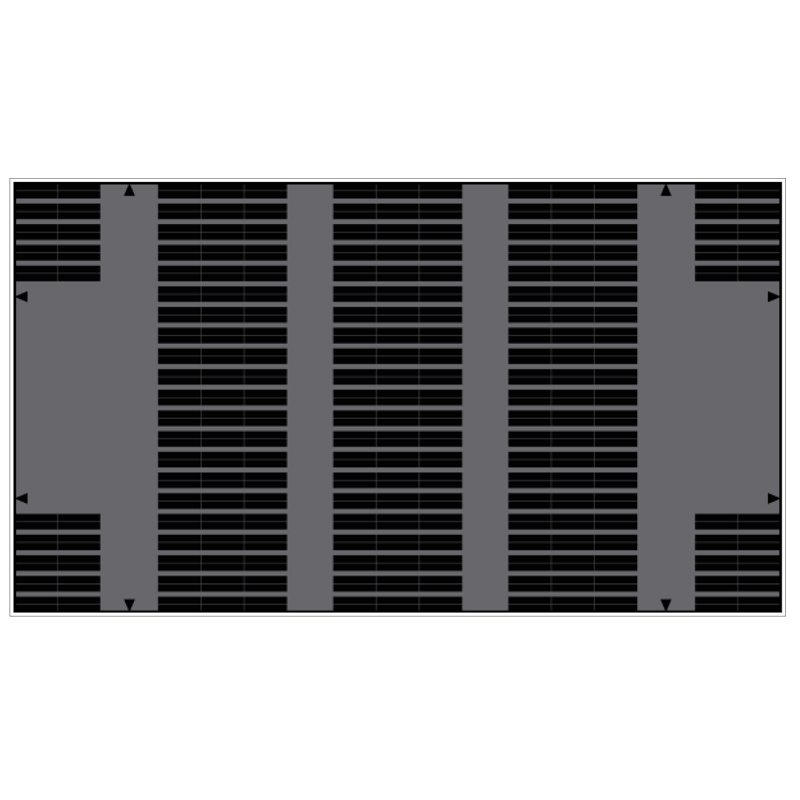
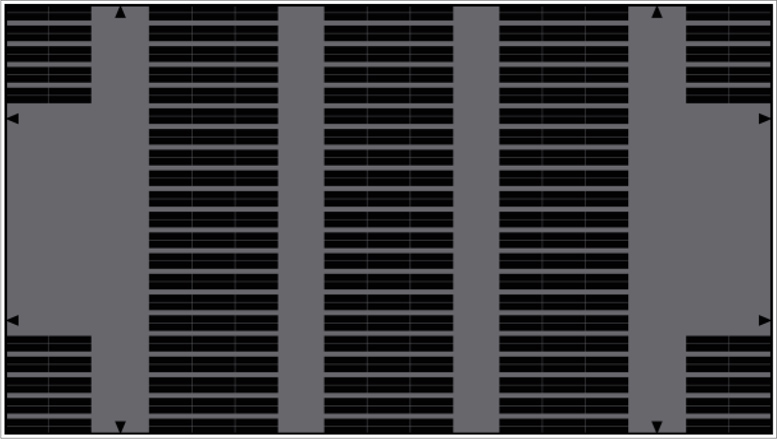
The test chart with an aspect ratio of 16:9 shows in the middle area 9 blocks containing 42 resolution patterns each. The corner fields have 20 resolution patterns.
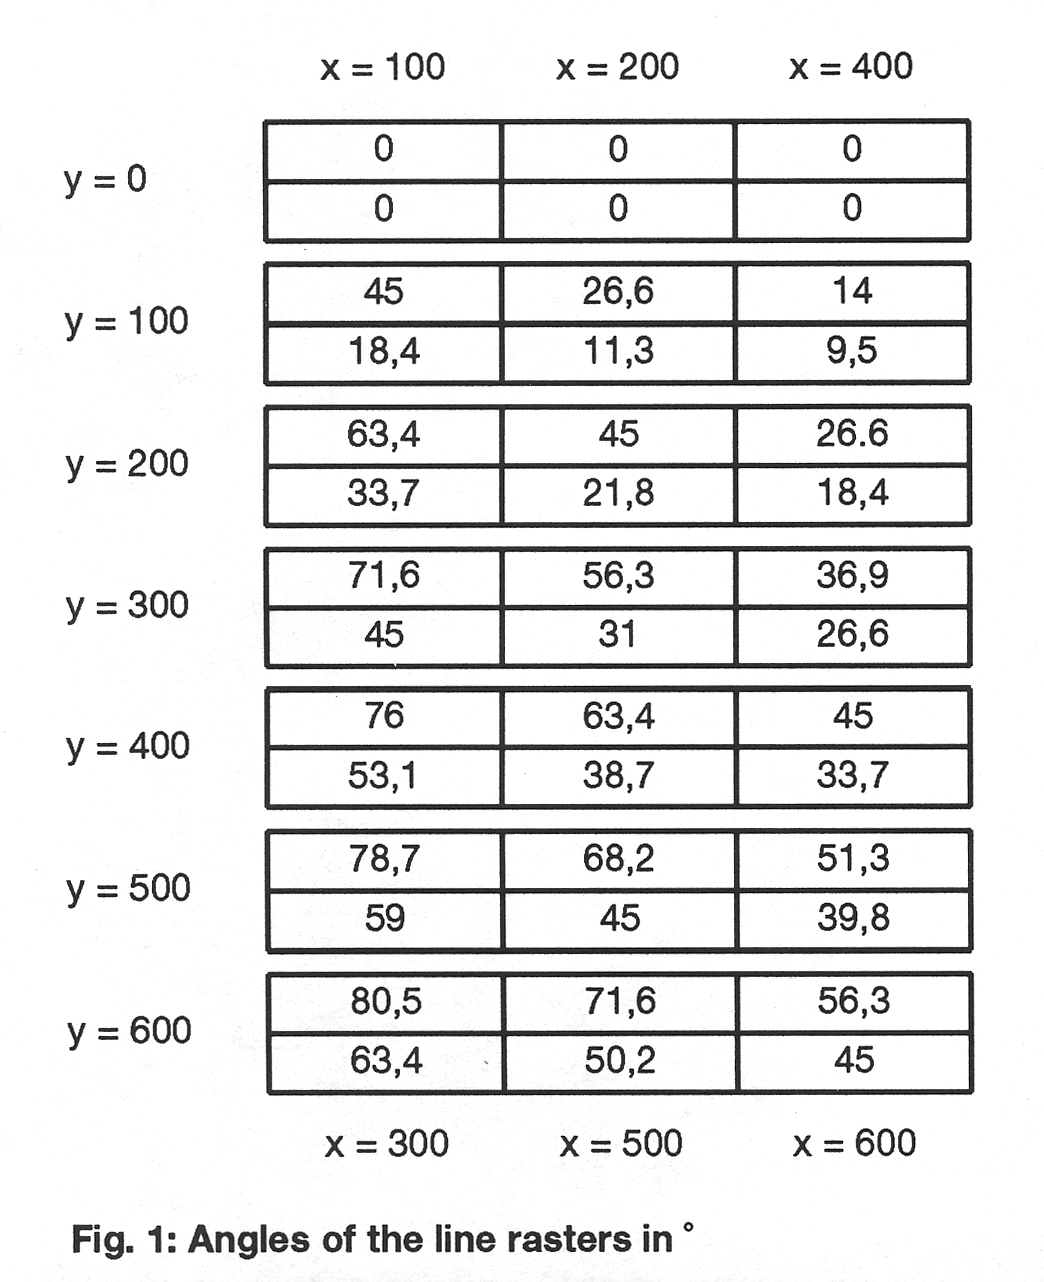 The resolution patterns are arranged in such a way that the local frequency of x and y have a full 100 cph. Therefore, for any pattern with y ≠ 0 the resolution lines have a different angle. The angle of each pattern is indicated in fig.1. The angles of the lower and the central block were rotated by 90° compared with the remaining blocks.
Frequencies are indicated in cph (cycles per height). For a better survey frequencies are indicated only for the 4 outer and 5 of the inner blocks. x is indicated only for two of the 7 (5) pattern rows. The indication for x = 100, 200 and 400 is above and the indication for x = 300, 500 and 600 is below the respective resolution pattern.
The test chart is particularly suited for measurements by oscilloscopes. Measurements with a frequency analyser cause further efforts, which are not described in detail in this paper. The oscilloscope has to be triggered to a determine line. The position of this line within the chart determines the local frequency. This is easier, if the selected line can be unblanked on the monitor, as is usual for camera control units. The great advantage of this test chart is to have many periods of the same frequency, which enables a more precise measurement. Using a digital storage oscilloscope, noise reduction is possible but also a Fourier transformation of the burst, which results from a resolution pattern.
The modulation transfer function of a camera can be defined with the TE124 test chart at 13 x 6 test points (s.fig. 2), whereby the highest frequencies in general will not be resolved. A resolution pattern with only horizontal lines is deliberately left out because of the difficulty to measure such a pattern within the TV-line structure. The modulation transfer function is symmetrical to point (therefore in fig. 2 every test point is shown twice), but for valve cameras the MTF is not symmetrical to the axis, therefore the line patterns were laid both diagonal directions. To define both parts of the MTF on the sam spot within the chart area, the test chart may be rotated by 180°. Thereby the diagonal direction changes in the resolution patterns. For measurement in the corner fields a reduced number of resolution patterns is available.
The grouping of the resolution patters within a six pattern block was chosen with respect to the uneven harmonic. This is an advantage with evaluations by Fourier transformations or with a frequency analyser. 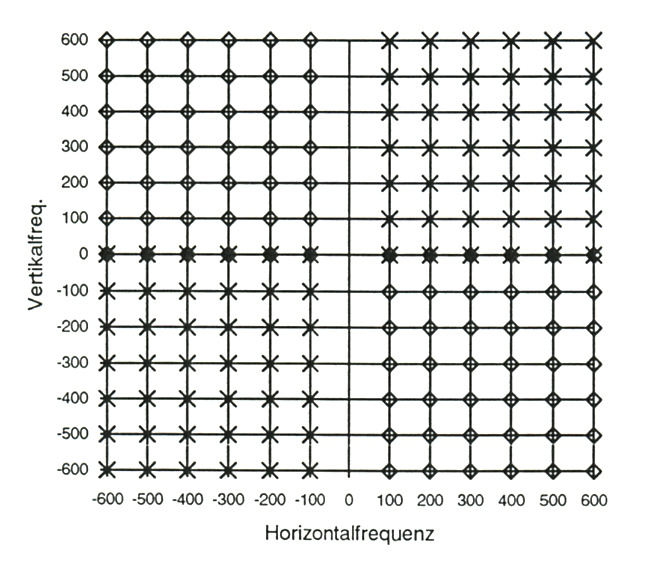
Fig. 2: Measuring points on the local frequency level
X: line raster with / - direction
◊: line raster with - direction