


-
Hotline0086-755-27198826-601
- emai:y@3nh.com
- add:F/6, Block 5B, Skyworth Inno Valley, Tangtou 1st Road, Shiyan, Baoan District, Shenzhen, P.R. China.


Window Test Chart YE0156
- Product Introduction The test chart is designed to measure blooming and smearing effects of CCD cameras. The transparency consists of a black area (density 3.0) with a white (transparent) area (density incl. glass planes ca 0.15). The trans

-
Product details
-
Parameters
Product Introduction
The test chart is designed to measure blooming and smearing effects of CCD cameras.
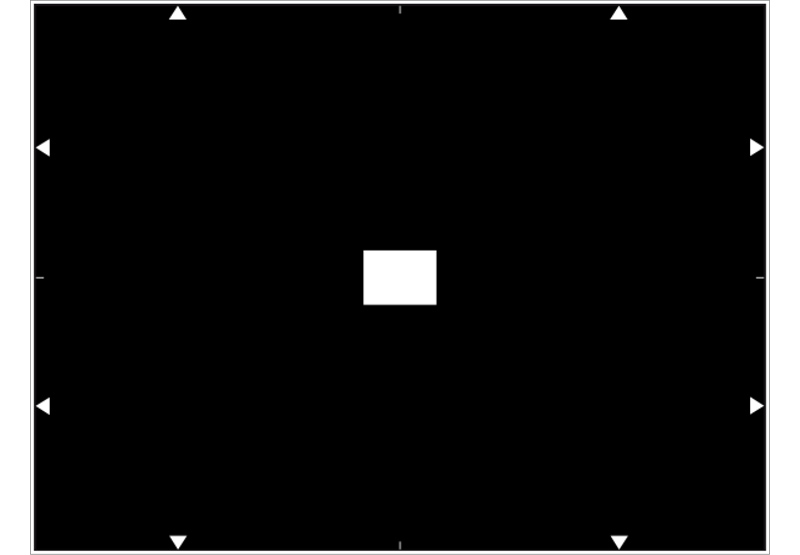
The transparency consists of a black area (density > 3.0) with a white (transparent) area (density incl. glass planes ca 0.15). The transparent area has 1% of the picture area, marked by the white arrows.
The measuring equipment shall be arranged as shown in fig. 2.
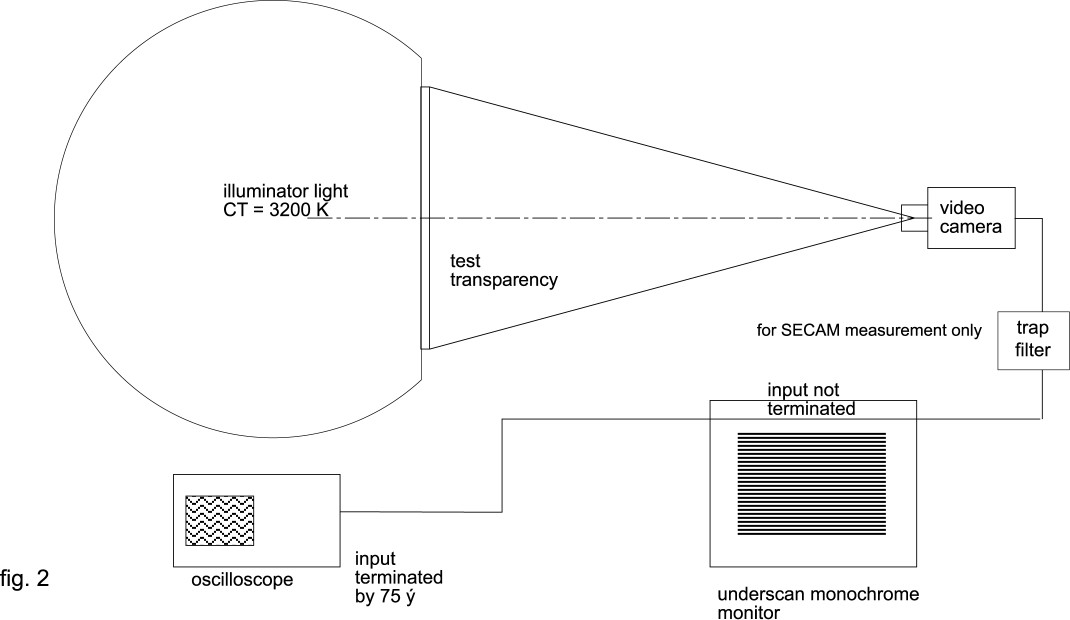
The conditions shooting shall be as the follows
• The light density of the transparency version shall be 636 cd/m² +/- 5% (= 2000lx) at peak white.
• The correlated colour temperature of the light source shall be 3200 K +/- 100K. The white balance shall be set manually or automatically to 3200K +/- 100 K.
• The test chart shall be shot by the camera so that the frame limited by the arrows exactly coincides with the edges of the picture displayed on the monitor underscan mode.
• The focus control shall be in auto or manual mode and shall be in best focus.
• The iris control shall be in auto or manual mode.
• Gain control shall be set to “0 dB”.
• Optical filter if any shall be set to “open” position.
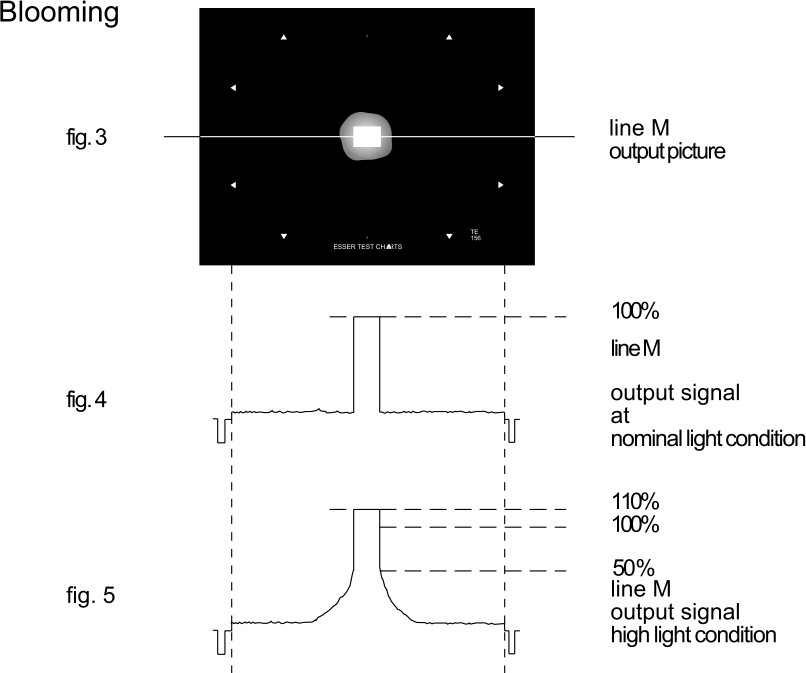
Blooming
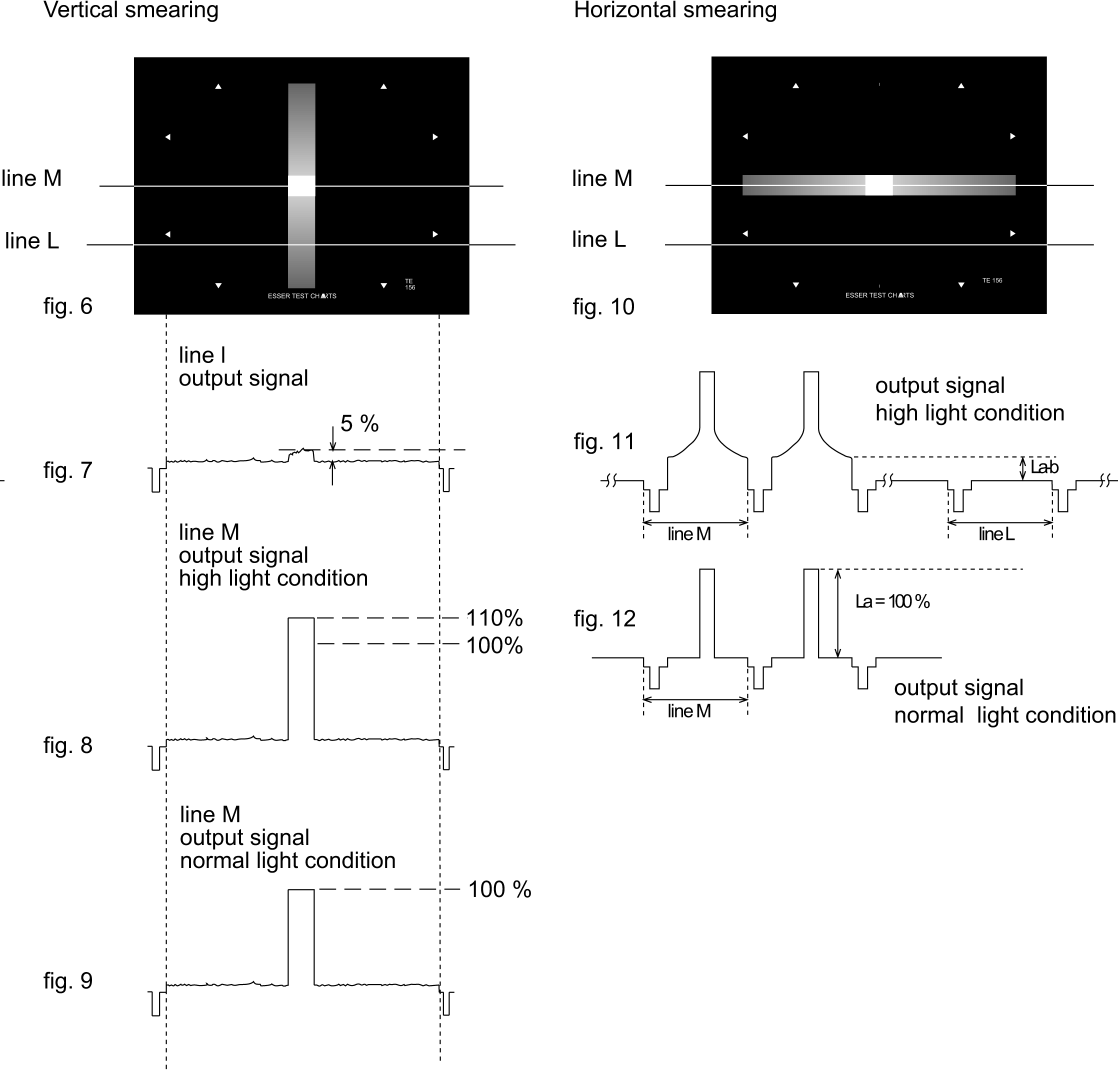
Method of measurement of vertical smearing
1.The output signal shall be measured by an oscilloscope. Two measurements shall be made as explained below:
a)The line L (fig. 6) shall be selected on the oscilloscope. The light density filter shall be reduced so far that the amplitude of the signal due to smearing becomes 50% of the 100% white signal (fig. 7). The resulting light density shall be noted.
b)The line M (fig. 6) shall be selected on the oscilloscope. The light density of the illuminator shall be reduced as far to provide rated signal level, that is 100% white level (fig. 8 and 9). The resulting light density shall be noted.
2.The ratio between the maximum illumination providing smearing signal of 5% and that corresponding to provide the rated signal level shall be calculated be the following formula:
Vertical smearing ratio = illumination for 5% smearing level / illumination for 100% signal level
Note: In case there is no possibility to adjust the light density of the illuminator, ND filter shall be put in front of the camera. It shall be selected in such a way that the signal levels described above shall be attained. The density D of the ND filter, which attains the second signal level each, gives the result of the blooming and smearing ratios: 10D