


Column navigation
Recommended Products


contact us
-
Hotline0086-755-27198826-601
- emai:y@3nh.com
- add:F/6, Block 5B, Skyworth Inno Valley, Tangtou 1st Road, Shiyan, Baoan District, Shenzhen, P.R. China.


100% WHITE TEST CHART YE178
- Product Introduction The test chart consists of a blank film between two glass panes. The (reprographic) film is of the same material as the other ESSER TEST CHARTS transparencies (D280, D240, D205). The test chart is designed for shading m

-
Product details
-
Parameters

Product Introduction
The test chart consists of a blank film between two glass panes. The (reprographic) film is of the same material as the other ESSER TEST CHARTS transparencies (D280, D240, D205).
The test chart is designed for shading measurement under the same lightning conditions as other transparency measurements.
It is possible to perform shading measurements on illuminator (LG2, LE6) without any chart. But then lightning conditions are different to other measurements with test transparencies. By using a test transparency the light intensity of an illuminator changes. This is caused by two superimposed factors
a) the filter effect of the film and glass (25% light absorption) and
b) the light remission of the transparency ack in the illuminator
While factor a) is predominat with th LG2, the remission factor b) is predominant with the lightning sphere LE6, i.e. the light intensity rises significantly when a test chart is inserted. To carry out shading measurement under the same lighting condition as other measurements the use of the TE178 is essential.
Measuring conditions Gamma correction: ON Iris aperture: F/4 2/3” CCD Gain: 0dB
White balanced
The illumination of the test chart has to be adjusted so that the R, G, B output signals are equal to 700mV/75ohms (nominal amplitude). Lens initially focussed on the test chart (or an other suitable test chart
e.g. TE120) and then de-focussed.
The test chart is designed for shading measurement under the same lightning conditions as other transparency measurements.
It is possible to perform shading measurements on illuminator (LG2, LE6) without any chart. But then lightning conditions are different to other measurements with test transparencies. By using a test transparency the light intensity of an illuminator changes. This is caused by two superimposed factors
a) the filter effect of the film and glass (25% light absorption) and
b) the light remission of the transparency ack in the illuminator
While factor a) is predominat with th LG2, the remission factor b) is predominant with the lightning sphere LE6, i.e. the light intensity rises significantly when a test chart is inserted. To carry out shading measurement under the same lighting condition as other measurements the use of the TE178 is essential.
Definition of white shading or white level uniformity
Determination of maximum white level variations in various areas of the picture, when the camera is directed at an evenly illuminated test chart.Measuring equipment
Oscilloscope; video amplitude meterMeasuring conditions Gamma correction: ON Iris aperture: F/4 2/3” CCD Gain: 0dB
White balanced
The illumination of the test chart has to be adjusted so that the R, G, B output signals are equal to 700mV/75ohms (nominal amplitude). Lens initially focussed on the test chart (or an other suitable test chart
e.g. TE120) and then de-focussed.
Shading correctors: ON
Zoom: Positioned to minimize the effect of vignetting and shading of the test chart.
Measuring procedures
Measurements are made on the R, G, B signals at the camera output and then repeated for two picture zones defined as follows: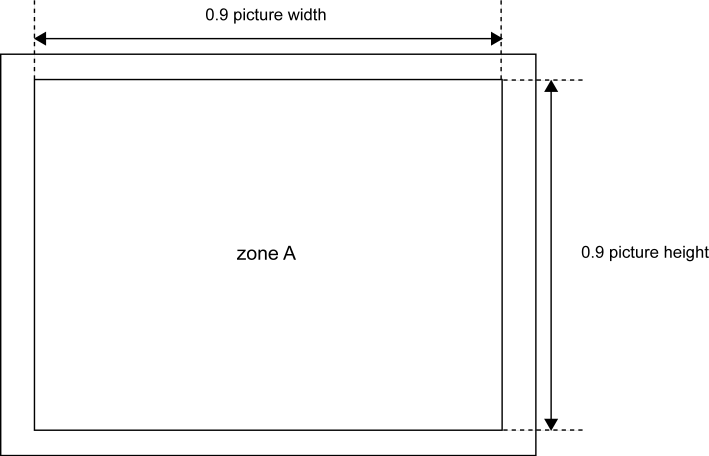
a) within a rectangular zone, the height and width of the picture (zone A)
b) outside this rectangle (zone B)
On the basis of these measurements, the differences of level for R-G, R-B and B-G are calculated and the maximum peak-to-peak variantions recorded for each zone.
100% WHITE TEST CHART YE178