


Column navigation
Recommended Products


contact us
-
Hotline0086-755-27198826-601
- emai:y@3nh.com
- add:F/6, Block 5B, Skyworth Inno Valley, Tangtou 1st Road, Shiyan, Baoan District, Shenzhen, P.R. China.


Saw Tooth Signal Test Chart YE0192
- The test chart shows a linear continuous progression from 0% transmission (left) to 100% transmission (right) set on a gray background (transmission 18%, density = 0.75). Left and right of this progression black reference areas of 22% of th

-
Product details
-
Parameters
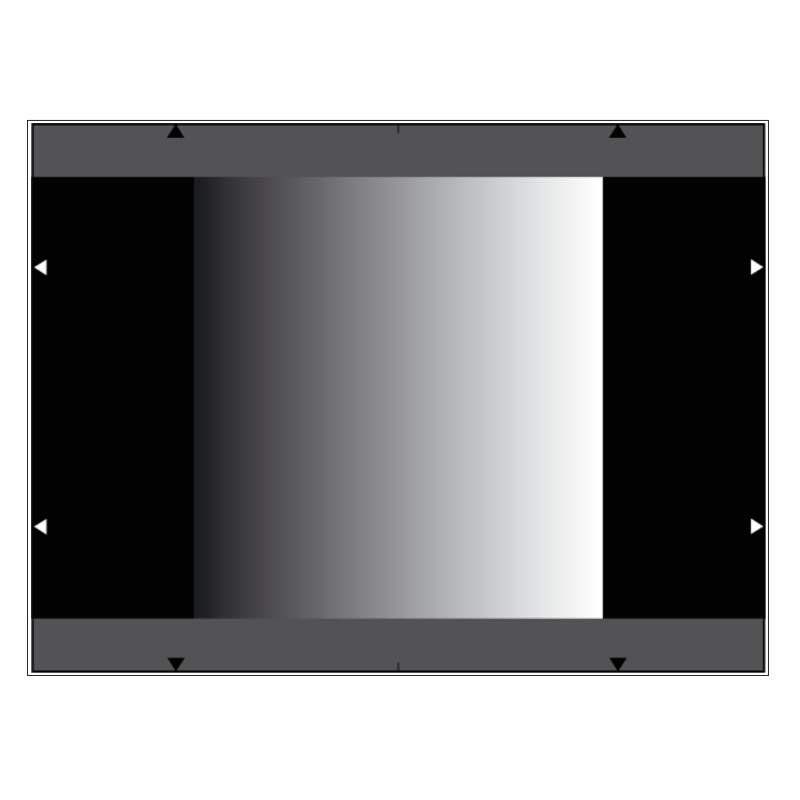
The test chart shows a linear continuous progression from 0% transmission (left) to 100% transmission (right) set on a gray background (transmission 18%, density = 0.75). Left and right of this progression black reference areas of 22% of the picture width are located. The height of the progression and these black areas is 81% of the picture height.
The test chart is designed for cameras without an integrated electronic saw tooth signal. It allows the gamma correction of the camera to be visualized on the oscilloscope (see illustration below). The central horizontal line represents the gray background at the top and bottom of the test chart, adjusted to 50% signal level.
If required, the test chart can be supplied in a second version where the background shows a transmission of 28% (density = 0.56). This corresponds to the gray step located in the center of test chart YE0153 (Sony standard) and its background.
Saw Tooth Signal Test Chart