


Column navigation
Recommended Products


contact us
-
Hotline0086-755-27198826-601
- emai:y@3nh.com
- add:F/6, Block 5B, Skyworth Inno Valley, Tangtou 1st Road, Shiyan, Baoan District, Shenzhen, P.R. China.

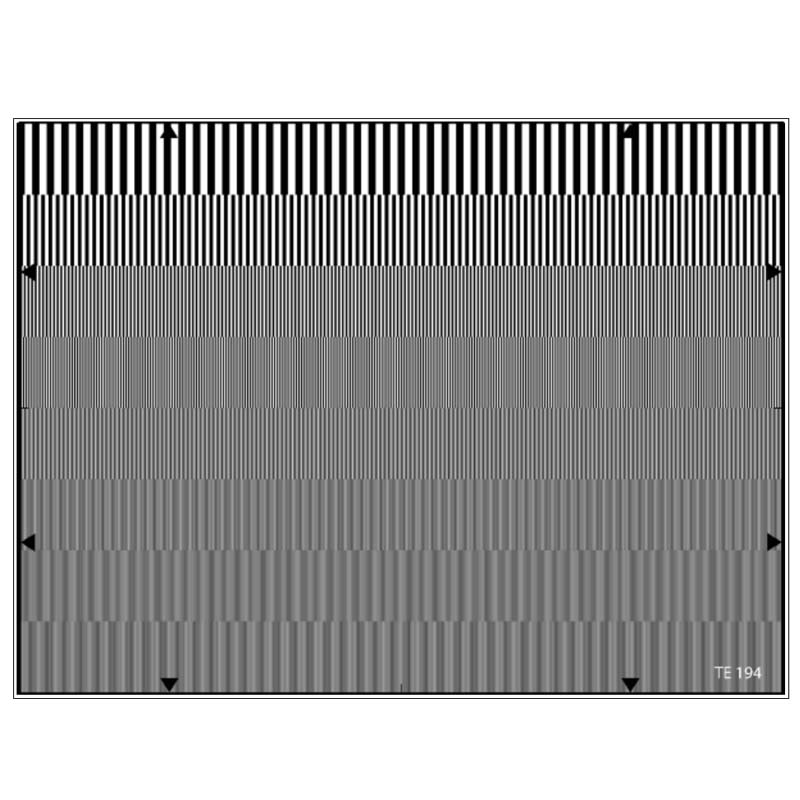
Aliasing Test Chart YE0194
- The YE0194 is designed for measuring aliasing. The chart consists of eight rows of rectangular bars with the spatial frequencies of 1, 2, 4, 6, 8, 10, 12 and 14 MHz. Aliasing effects are moir distortions caused by interferences of two raste

-
Product details
-
Parameters

The YE0194 is designed for measuring aliasing.
The chart consists of eight rows of rectangular bars with the spatial frequencies of 1, 2, 4, 6, 8, 10, 12 and 14 MHz.
The chart consists of eight rows of rectangular bars with the spatial frequencies of 1, 2, 4, 6, 8, 10, 12 and 14 MHz.
Aliasing effects are moiré distortions caused by interferences of two rasters. Independent of the type of camera aliasing effects can arise by interferences of motive rasters and the TV line structure e.g. the well known venetian blind effect or textile stripe patterns.
CCD cameras have a special immanent aliasing problem caused by the spatial image sampling. The spectrum of the signal obtained at the camera output is compromised of a basic spectrum repeated around multiples of the CCD sampling frequency. The CCD sampling frequency depends on the CCD size and the number of the pixels per CCD width. For some high spatial frequencies of the image, the condition dictated by sampling theorem is not met, so that the basic spectrum and duplicated spectrum can be superimposed and give rise to inter-frequency beats. The result is moiré in the pictures.
Moiré visibility depends on the type of analyser, on the camera's low pass optical filtering and on the spatial frequency of the test pattern analysed.
The YE0194 consists of 8 rows of rectangular bars the spatial frequencies of 1, 2, 4, 6, 8, 10, 12 and 14MHz. To adjust the odd frequency values 3 to 13 the picture has to be zoomed in a way that it is limited by the respective markings (arrows) on the upper and bottom edge of the test chart. The frequency then refers to the row with the next lower even frequency each.
Measurement procedures can be made with a spectrum analyser or a wide-band video oscilloscope.
Aliasing Test Chart