


Column navigation
Recommended Products


contact us
-
Hotline0086-755-27198826-601
- emai:y@3nh.com
- add:F/6, Block 5B, Skyworth Inno Valley, Tangtou 1st Road, Shiyan, Baoan District, Shenzhen, P.R. China.

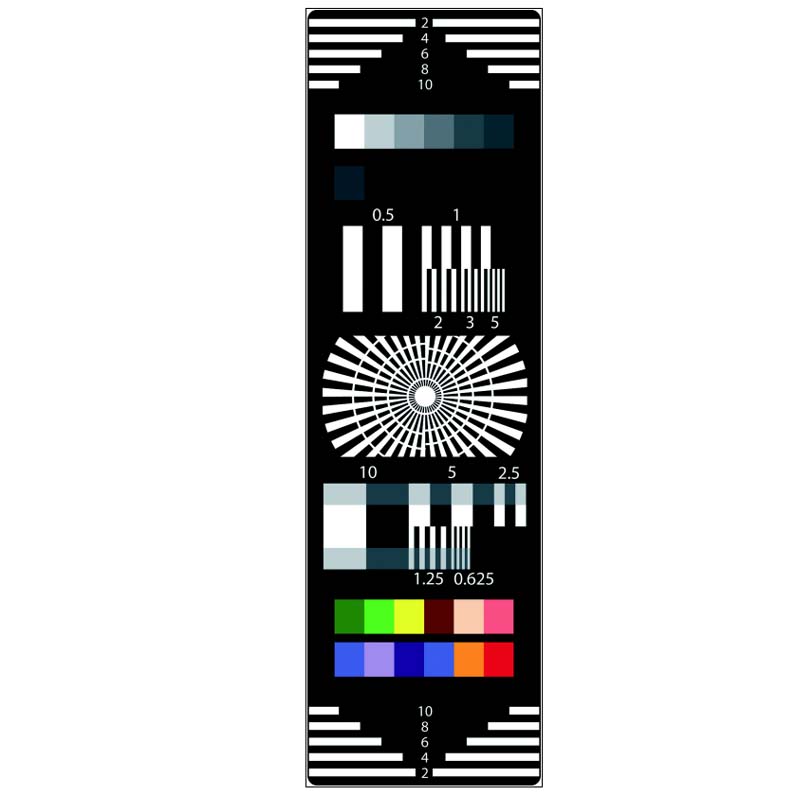
Surveillance Camera Test Chart YE0235
- The YE0235 servers for on-site testing of surveillance cameras. The size approx. 50x180 cm (19.7 x 70.9) (width and height) and thus roughly corresponds to the size of a person. At its top an bottom there are numbered black and white line p

-
Product details
-
Parameters

The YE0235 servers for on-site testing of surveillance cameras.
The size approx. 50x180 cm (19.7” x 70.9”) (width and height) and thus roughly corresponds to the size of a person.
At its top an bottom there are numbered black and white line pairs, which correspond to 2% of the picture height each. When the test chart is placed in a position where its height does not correspond to the monitor height it is easy to determine a correction factor (in %) with those line pairs. In the middle of the line pairs the (even) percentage figures are marked. If e.g. in the monitor just the upper white bar with the no. 4 and the lower black bar between the no. 4 and 6 of the chart is to be seen, then the correction factor is 4% +5% = 9%.
For measuring resolution black and white line rasters both are used in MHz and in cm. The MHz bursts are located in the upper area and are graded in 0.5, 1, 2, 3 and 5MHz. If the correction factor is 9% (see example above) the frequencies must be multiplied by 1.09.
For measuring resolution black and white line rasters both are used in MHz and in cm. The MHz bursts are located in the upper area and are graded in 0.5, 1, 2, 3 and 5MHz. If the correction factor is 9% (see example above) the frequencies must be multiplied by 1.09.
In the lower area there are bars in cm, their structure width being 10, 5, 2.5, 1.25 and 0.625 cm. In the upper and lower half contrast is reduced to 1: 4 (contrast of the black and white structures is 1:20). The structure width of 1.25 corresponds to the width of number plate figures and letters. In the middle of the picture there is a sector star of 36 sectors with its top and bottom cut.
The white semicircles indicate resolutions in MHz on the right side and in cm on the left side. In the unresolved center resolution is 5MHz. The unresolved center of the sector star contains a black and white cone. It helps for adjusting the test chart to the camera. In the ideal case the cone shows regular black and white circles in the monitor picture.
The upper area of the test chart shows in addition a gray scale with 12 equal density steps: reference white, D ~ 0.15 to 1.65. In the bottom area there are 12 colors fields with critical colors, which are similar to those of the Macbeth ColorChecker.
Surveillance Camera Test Chart